Anyone who’s worked with the markets for any length of time will have come across Renko charts. At first sight they are weird charts made of consecutive bricks but once you get used to them they’re great ways of filtering out noise and simplifying the price action. For this reason many people like using them but how do you use them within a platform like Metatrader4? The issue with them is of course that they don’t have the same constant time intervals that standard charts have and for this reason they don’t come as standard with the platform. Instead you have to use Offline Charts in order to create them. Here’s how to do this and the various pitfalls that you have to watch out for when using EA’s on them.
1. First you need to find an EA to create the offline charts. The one that I use is called RenkoLiveCharts_pimped (followed by a version number). If you Google this then you should find somewhere where you can download it.
2. Apply this EA to a 1M chart of the market that you’re interested in. Make sure that you configure it correctly – this is where the first “Gotcha” comes in. If you make the box size too small (the RenkoBozSize input) then your Mt4 program will hang completely as it desperately tries to create a brick for every pipette! There’s no way out of this apart from killing the process with the Task Master so I would always recommend that in the first instance you start off with a big value for the box size and then work downwards once you’ve calibrated how the points and pips correspond for the market in question.
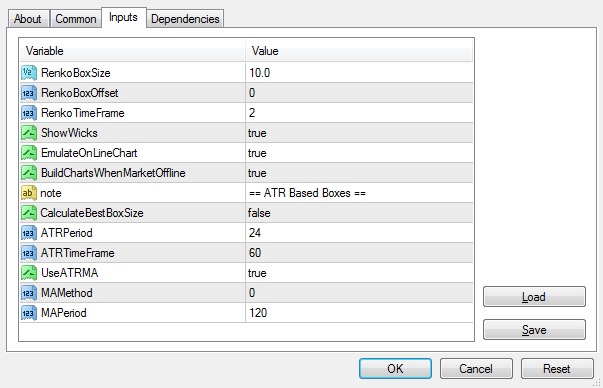 Note the RenkoBoxSize and the RenkoTimeFrame parameters, which are the two important ones
One other point to check is that you’ve got EA’s enabled. In the top right hand corner you should see the EA face symbol is smiling. If it’s frowning then you need to remove the EA, enable EA Trading and then re-apply it.
3. Once you’ve got the EA working correctly then in the top left hand corner it will say where it’s written the offline file. For those of you who’ve not used an offline file before, basically it’s a cache where historic data can be stored. It’s also where custom timeframe data files are created – this is where the Custom Time Period script writes its files for example. So in the settings above you can see that the RenkoTimeFrame setting was set to 2 which means that as I applied it to a EURUSD chart I need to look for the market EURUSD,2M in the offline files. To do this go to the File | Open Offline menu option where you should see a selection of all the files
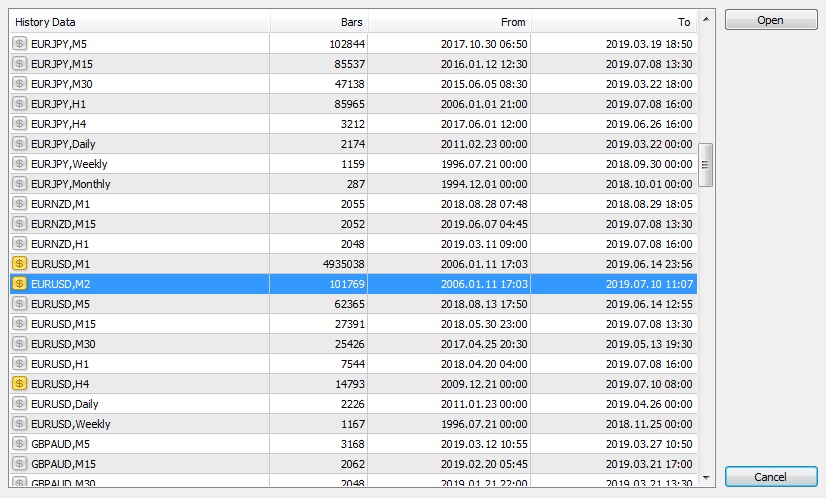
4. Select the EURUSD2M file and click the Open button. This should now create your Renko Chart.
5. We are nearly there now. There are just a couple of points to bear in mind:
a) to ensure that your Renko charts keep updating you need to keep the 1M “driver” chart running the whole time in the background. This chart is the one that’s actually creating the data so if you close it down then your Renko charts will stop updating
b) Finally, right-click on the Renko chart and select Properties. Then go to the Common tab and make sure that Offline chart is unticked. If you don’t do this then you won’t be able to run any EA’s on the chart. If you forget to do this then you’ll just be left scratching your head as to why you can’t get your EA to work!
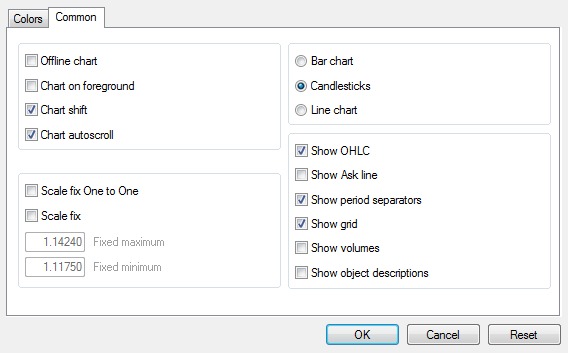 Untick Offline chart
That should be it! Renko charts are a great way of looking at the market and using EA’s to automate your trading with them is a wonderful way of ensuring that you don’t miss any trades or stop-loss adjustments.